Configuring#
Besides being super convenient, ahlive is super customizable.
keywords#
Common settings can be accessed through documented keywords.
For a list of documented keywords, see help(ah.Array).
[1]:
import ahlive as ah
ah.Array([0, 1, 2], [3, 4, 5], figsize=(3, 3)).render()

gifsicle: warning: trivial adaptive palette (only 50 colors in source)
[1]:

Do not expect all the keywords exposed in ahlive to match the matplotlib keywords!
This is because some keywords are too generic in matplotlib, e.g. plt.margins(x=1) is exposed as xmargins=1
Any keywords not documented are assumed to be plot keywords.
For example in vanilla matplotlib, to change the marker type:
[2]:
import matplotlib.pyplot as plt
_ = plt.scatter([0], [3], marker='o')
_ = plt.scatter([1], [4], marker='^')
_ = plt.scatter([2], [5], marker='v')
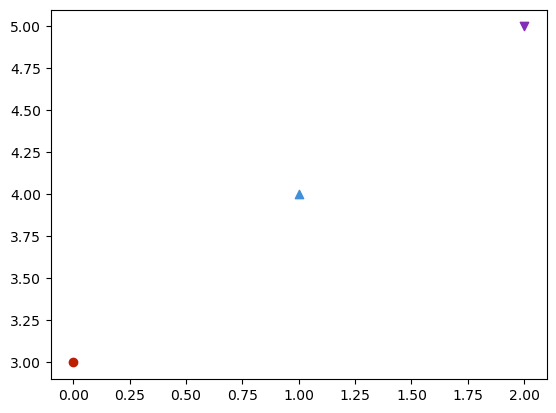
Here, although marker is not documented in ahlive’s docstring, it can still be used.
[3]:
import ahlive as ah
ah.Array([0, 1, 2], [3, 4, 5], marker=['o', '^', 'v']).render()
gifsicle: warning: trivial adaptive palette (only 68 colors in source)
[3]:

These plot keywords can be a scalar too.
[4]:
import ahlive as ah
ah.Array([0, 1, 2], [3, 4, 5], marker='^').render()
gifsicle: warning: trivial adaptive palette (only 62 colors in source)
[4]:

config#
However, because matplotlib is huge, not all keywords can be exposed. Instead, ahlive has a generic config method.
To set figsize without the built-in keyword, first pass the name of the method followed by the keyword arguments.
For example, to set figsize in vanilla matplotlib:
[5]:
import matplotlib.pyplot as plt
_ = plt.figure(figsize=(3, 3))
<Figure size 300x300 with 0 Axes>
The method is figure so that will be the first positional argument passed to config, and then the keyword argument is figsize=(3, 3).
[6]:
import ahlive as ah
arr = ah.Array([0, 1, 2], [3, 4, 5])
arr.config('figure', figsize=(3, 3)).render()
gifsicle: warning: trivial adaptive palette (only 50 colors in source)
[6]:
Or another way of doing this is to pass a nested dictionary; this way, multiple methods can be configured simultaneously.
[7]:
import ahlive as ah
arr = ah.Array([0, 1, 2], [3, 4, 5])
arr.config(**{
    'figure': {'figsize': (3, 3)},
    'axes': {'xlim': [0, 4], 'ylim': [0, 10]}
}).render()
gifsicle: warning: trivial adaptive palette (only 45 colors in source)
[7]:

However not all methods are named exactly as their matplotlib counterpart!
For example to set color in vanilla matplotlib:
[8]:
import matplotlib.pyplot as plt
plt.scatter([0, 1, 2], [3, 4, 5], color='red')
[8]:
<matplotlib.collections.PathCollection at 0x7feef9f41050>
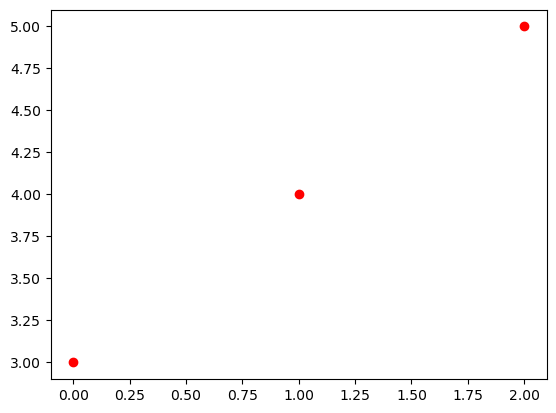
The method is not scatter in ahlive, instead it’s plot! This is so that ahlive can handle plot, scatter, bar, etc. without too complex internal code.
[9]:
import ahlive as ah
arr = ah.Array([0, 1, 2], [3, 4, 5])
arr.config('plot', color='red').render()
gifsicle: warning: trivial adaptive palette (only 43 colors in source)
[9]:

Furthermore, methods are often prefixed: ref_ for references, grid_ for grids, remark_ for remarks, etc.
[10]:
import ahlive as ah
arr = ah.Reference([0, 1, 2])
arr.config('ref_plot', color='red').render()
gifsicle: warning: trivial adaptive palette (only 71 colors in source)
[10]:

To get a full list of configurable methods:
[11]:
import ahlive as ah
for key, val in ah.CONFIGURABLES.items():
    print(f"{key}\n{val}\n")
canvas
['figure', 'suptitle', 'pool', 'animate', 'durations', 'savefig', 'watermark', 'spacing', 'interpolate', 'output']

subplot
['axes', 'plot', 'preset', 'legend', 'grid', 'xticks', 'yticks', 'limits', 'margins', 'adjust_text', 'hooks']

label
['state', 'inline', 'xlabel', 'ylabel', 'title', 'subtitle', 'caption', 'note', 'preset_inline']

geo
['crs', 'projection', 'borders', 'coastline', 'land', 'lakes', 'ocean', 'rivers', 'states', 'tiles']

color
['colorbar', 'clabel', 'cticks']

remark
['remark_plot', 'remark_inline']

grid
['grid_plot', 'grid_inline']

ref
['ref_plot', 'ref_inline']
hooks#
Still, there’s lots to be desired that ahlive is incapable of doing. Therefore, if there’s a need, things can be done the vanilla matplotlib way first and wrapped into a function listed in hooks.
[12]:
import ahlive as ah
import matplotlib.pyplot as plt
import numpy as np

def add_twinx(fig, ax):
    ax2 = ax.twinx()
    ax2.set_ylabel('The twin axes')
    ax2.set_ylim(0, 24)

ah.Array([0, 1], [0, 12], hooks=[add_twinx], scheduler="threads").render()
gifsicle: warning: trivial adaptive palette (only 63 colors in source)
[12]:

hooks accept multiple custom functions.
style#
Setting style='minimal' reduces the number of tick labels and grid lines.
[13]:
import ahlive as ah
ah.Array([0, 1, 2], [3, 4, 5], style='minimal').render()
gifsicle: warning: trivial adaptive palette (only 67 colors in source)
[13]:

Setting style='bare' removes all tick labels, grid lines, borders, and spacing around the subplot.
[14]:
import ahlive as ah
ah.Array([0, 1, 2], [3, 4, 5], style='bare').render()
gifsicle: warning: trivial adaptive palette (only 11 colors in source)
[14]:

defaults#
To get a full list of configurable defaults:
[15]:
import ahlive as ah
for key, val in ah.DEFAULTS.items():
    print(f"{key}\n{val}\n")
durations_kwds
{'aggregate': 'max', 'transition_frames': 0.022222222222222223, 'final_frame': 0.55}

label_kwds
{'fontsize': 16, 'replacements': {'_': ' '}, 'color': '#262626', 'comma': False}

preset_kwds
{'trail': {'chart': 'scatter', 'expire': 100, 'stride': 1, 'zorder': 0}, 'morph_trail': {'chart': 'line', 'expire': 1, 'stride': 1, 'zorder': 0}, 'race': {'bar_label': True, 'limit': 5, 'ascending': False, 'annotation_clip': True}, 'delta': {'bar_label': True, 'capsize': 6}, 'scan': {'color': 'black', 'stride': 1}}

plot_kwds
{'pie': {'normalize': False}, 'scatter': {'alpha': 0.9}, 'bar': {'alpha': 0.9}, 'barh': {'alpha': 0.9}}

grid_plot_kwds
{'streamline': {'zorder': 2}, 'quiver': {'zorder': 2}, 'barbs': {'zorder': 2}}

ref_plot_kwds
{'rectangle': {'facecolor': '#696969', 'alpha': 0.45}, 'scatter': {'color': '#696969', 'marker': 'x'}, 'axvline': {'color': '#696969', 'linestyle': '--'}, 'axhline': {'color': '#696969', 'linestyle': '--'}, 'axvspan': {'color': '#696969', 'alpha': 0.45}, 'axhspan': {'color': '#696969', 'alpha': 0.45}}

remark_plot_kwds
{'marker': 'x', 'persist': True}

xlabel_kwds
{'fontsize': 16, 'replacements': {'_': ' '}, 'color': '#262626', 'comma': False}

ylabel_kwds
{'fontsize': 16, 'replacements': {'_': ' '}, 'color': '#262626', 'comma': False}

clabel_kwds
{'fontsize': 16, 'replacements': {'_': ' '}, 'color': '#262626', 'comma': False}

title_kwds
{'fontsize': 19, 'replacements': {'_': ' '}, 'color': '#262626', 'comma': False, 'loc': 'left'}

subtitle_kwds
{'fontsize': 14.8, 'replacements': {'_': ' '}, 'color': '#262626', 'comma': False, 'loc': 'right'}

note_kwds
{'x': 0.05, 'y': 0.08, 'ha': 'left', 'va': 'top', 'width': 75, 'fontsize': 9}

caption_kwds
{'x': 0, 'y': -0.28, 'alpha': 0.7, 'ha': 'left', 'va': 'bottom', 'width': 90, 'fontsize': 11}

suptitle_kwds
{'fontsize': 19, 'replacements': {'_': ' '}, 'color': '#262626', 'comma': False}

state_kwds
{'fontsize': 48, 'replacements': {'_': ' '}, 'color': '#262626', 'comma': False, 'alpha': 0.5, 'xy': (0.988, 0.01), 'ha': 'right', 'va': 'bottom', 'xycoords': 'axes fraction'}

inline_kwds
{'fontsize': 16, 'replacements': {'_': ' '}, 'color': '#262626', 'comma': False, 'textcoords': 'offset points'}

text_inline_kwds
{'fontsize': 16, 'replacements': {'_': ' '}, 'color': '#262626', 'comma': False, 'textcoords': 'offset points'}

ref_inline_kwds
{'fontsize': 16, 'replacements': {'_': ' '}, 'color': '#262626', 'comma': False, 'textcoords': 'offset points'}

grid_inline_kwds
{'fontsize': 16, 'replacements': {'_': ' '}, 'color': '#262626', 'comma': False, 'textcoords': 'offset points'}

preset_inline_kwds
{'fontsize': 16, 'replacements': {'_': ' '}, 'color': '#262626', 'comma': False, 'textcoords': 'offset points', 'clip_on': True}

remark_inline_kwds
{'fontsize': 16, 'replacements': {'_': ' '}, 'color': '#262626', 'comma': False, 'textcoords': 'offset points', 'xytext': (-8, -5), 'ha': 'right', 'va': 'top', 'width': 38, 'persist': False}

margins_kwds
{'x': 0.03, 'y': 0.03}

adjust_text_kwds
{'precision': 1}

legend_kwds
{'fontsize': 16, 'replacements': {'_': ' '}, 'comma': False, 'labelcolor': '#262626', 'framealpha': 0.28, 'facecolor': 'whitesmoke', 'loc': 'upper left'}

colorbar_kwds
{'orientation': 'vertical'}

ticks_kwds
{'replacements': {'_': ' '}, 'comma': False, 'labelcolor': '#262626', 'length': 0, 'which': 'both', 'labelsize': 14.8}

xticks_kwds
{'replacements': {'_': ' '}, 'comma': False, 'labelcolor': '#262626', 'length': 0, 'which': 'both', 'labelsize': 14.8, 'axis': 'x'}

yticks_kwds
{'replacements': {'_': ' '}, 'comma': False, 'labelcolor': '#262626', 'length': 0, 'which': 'both', 'labelsize': 14.8, 'axis': 'y'}

cticks_kwds
{'replacements': {'_': ' '}, 'comma': False, 'labelcolor': '#262626', 'length': 0, 'which': 'both', 'labelsize': 14.8, 'num_colors': 11}

grid_kwds
{'show': True, 'alpha': 0.28, 'color': 'lightgray'}

tiles_kwds
{'style': 'toner'}

land_kwds
{'facecolor': 'whitesmoke'}

num_kwds
{'default': 1, 'bounds': (1, None), 'constant': True, 'precedence': 14}

watermark_kwds
{'x': 0.995, 'y': 0.005, 'alpha': 0.28, 'ha': 'right', 'va': 'bottom', 'fontsize': 9, 's': 'animated using ahlive'}

savefig_kwds
{'format': 'png', 'backend': 'agg', 'facecolor': 'white', 'transparent': False}

pool_kwds
{'max_workers': 2, 'scheduler': 'processes', 'progress': True}

animate_kwds
{'mode': 'I', 'loop': 0, 'pygifsicle': True}

cache_kwds
{'directory': '/home/docs/.ahlive/'}
To set, or update, defaults, specify the relevant key as a positional argument, and the desired keyword arguments.
Here, the the final and transition frames’ durations, or lag, is updated to 3 and 0.25 seconds respectively.
[16]:
import ahlive as ah

ah.config_defaults("durations", final_frame=3, transition_frames=0.1)

ah.Array([0, 1, 2], [3, 4, 5]).render()
gifsicle: warning: trivial adaptive palette (only 52 colors in source)
[16]:

Or equivalently; emphasis on the double asterisks if done this way!
import ahlive as ah

ah.config_defaults("durations", **{'final_frame': 3, 'transition_frames': 0.1})

ah.Array([0, 1, 2], [3, 4, 5]).render()
Or another way of doing this is to pass a nested dictionary; this way, multiple default keys can be configured simultaneously. The _kwds suffix is optional.
[17]:
import ahlive as ah

ah.config_defaults(**{
    "durations_kwds": dict(final_frame=5, transition_frames=0.5),
    "plot": {"scatter": dict(color="red", s=1000)}
})

ah.Array([0, 1, 2], [3, 4, 5]).render()
gifsicle: warning: trivial adaptive palette (only 85 colors in source)
[17]:

Note that some defaults require an extra layer of nesting, with the keys as the name of the chart, like for plot_kwds, ref_plot_kwds, preset_kwds.
The new defaults will persist the entire session until restarted.
[18]:
ah.Array([0, 1, 0], [6, -1, 2]).render()
gifsicle: warning: trivial adaptive palette (only 99 colors in source)
[18]:
